Read a report in this order: question, date range, source, visitor behavior, meaningful outcome, next decision. A larger number alone does not tell you whether growth improved.
Start with a question, not a dashboard
Opening analytics can feel like walking into a room where everyone is speaking at once. Users, sessions, events, impressions, engagement, revenue: each number answers a different question. Your job is to decide which question matters this week.
For a new website, ask: “Did anyone outside my team visit, and did they find what they needed?” For an established service business: “Which source brought inquiries we could actually help?” For a store: “Which landing pages brought orders after accounting for refunds?” Write the question before opening a report.
This walkthrough follows a fictional online workshop business. Its main action is a completed inquiry form. All numbers and illustrations below are teaching examples, not benchmarks, screenshots, or results from a real customer account.
Check the measurement before interpreting it
- Choose the property and date range. Confirm you are looking at the correct website. Compare complete periods with similar weekdays; make a note of launches, holidays, paid campaigns, or tracking changes.
- Confirm the important action. A button click is not a completed form. Test a successful submission, then check that the intended event arrives once. Exclude your test from business conclusions.
- Name the unit. Users, sessions, page views, event occurrences, and customers are different. A person can return for several sessions and submit more than one form.
- Check coverage. Consent choices, blocked scripts, missing tags, device changes, and processing delays can affect what appears. Reconcile purchases or accepted inquiries with your actual business records.
Do not spend an hour interpreting a dramatic decline before checking whether tracking stopped. Keep a simple change log beside your reports: date, change, expected effect, and who made it.
Read acquisition: where did visits come from?
In Google Analytics 4, find Traffic acquisition in Reports; navigation can vary by the report collection your property uses. Google distinguishes session-level Traffic acquisition from first-user-level User acquisition. Use the former to examine sources of visits; use the latter when investigating where people were first acquired. See Google’s explanation of the two scopes.
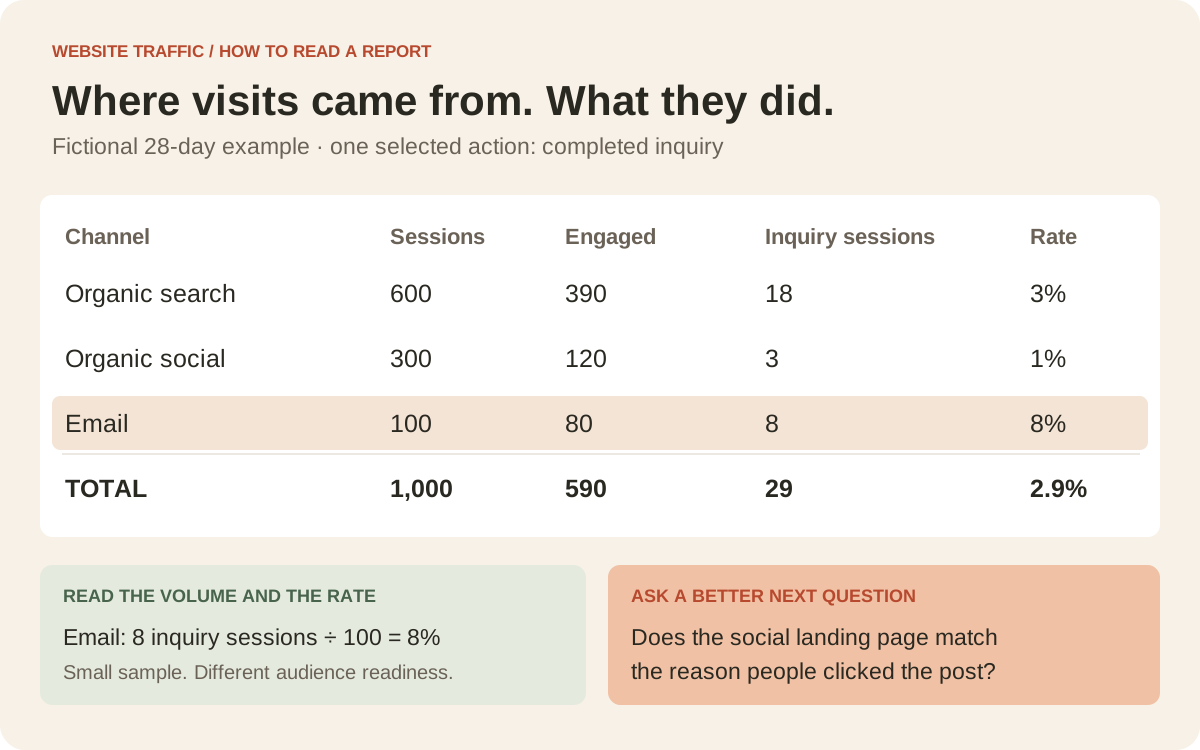
| Channel | Sessions | Engaged sessions | Inquiry sessions | Inquiry-session rate |
|---|---|---|---|---|
| Organic search | 600 | 390 | 18 | 3% |
| Organic social | 300 | 120 | 3 | 1% |
| 100 | 80 | 8 | 8% | |
| Total | 1,000 | 590 | 29 | 2.9% |
The first useful observation is not “email wins.” Email reached people who already knew the business, while social may have introduced it to strangers. There are only eight inquiry sessions from email. Audience readiness, the offer, the landing page, and sample size all matter.
Instead, ask why social visitors left without taking the next step. Filter to the social campaign and compare its landing page, device mix, and message with the post that sent people there. Check whether the page fulfills the promise in that post. A mismatch is a useful lead to investigate, not a conclusion from the table alone.
Read behavior: did people find something useful?
Google’s Traffic acquisition documentation defines engagement rate as engaged sessions divided by sessions, and session key event rate as sessions with a key event divided by sessions. Neither means “percentage of satisfied customers.” Engagement is a configured measurement rule, not a customer interview.
In our example, 590 of 1,000 sessions were engaged: 59%. The inquiry-session rate is 29 ÷ 1,000 = 2.9%. Do not calculate that second rate from all event occurrences; one session could contain multiple inquiry events. Select the relevant key event rather than combining newsletter signups, purchases, and unrelated actions into an unexplained total.
Now examine landing pages. A recipe that immediately answers “what oven temperature?” may be useful with a brief visit. A pricing page with long visits and no inquiries may be confusing. Interpret behavior against the page’s job. Pair the report with a few consented usability conversations or a manual review of the actual mobile page.
Read Search Console: were you seen, and chosen?
Search Console describes visibility and clicks in Google Search; Analytics describes measured activity on your site. In the Performance report, compare the same search type and dates, then use Queries or Pages to inspect a specific question. Google defines CTR as clicks divided by impressions and average position as an aggregate of the topmost result; it is not a stable rank for every visitor. See the Performance report guide.
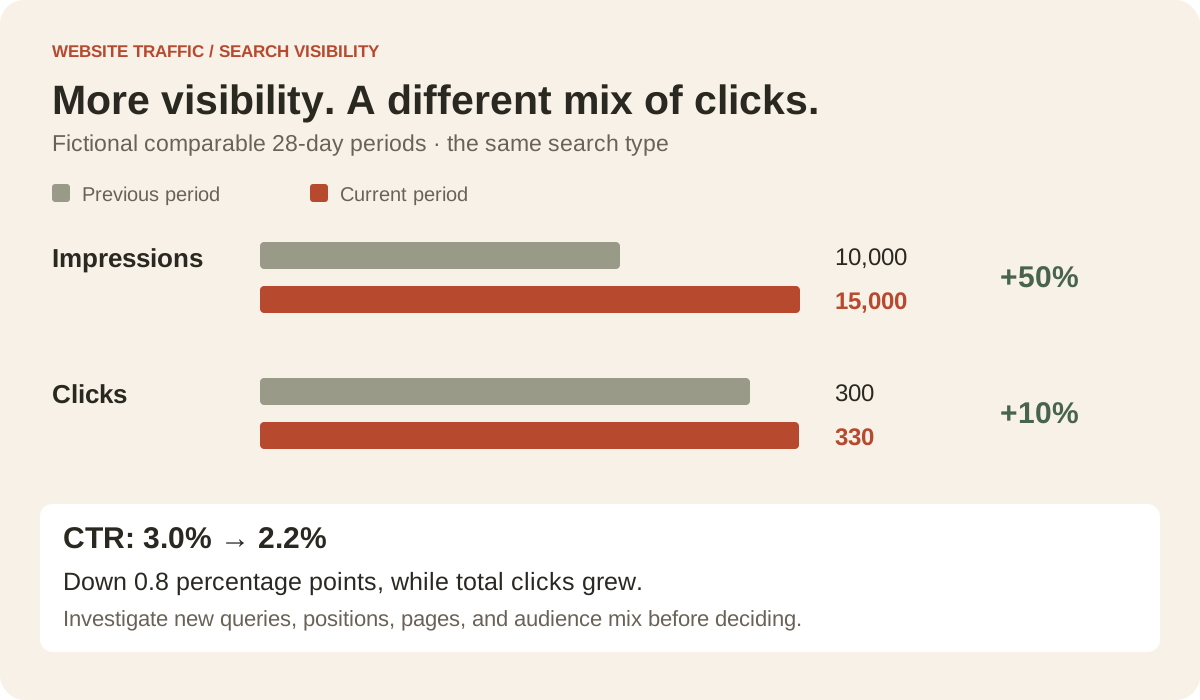
Here, impressions grew 50%, clicks grew 10%, and CTR fell from 3% to 2.2%—a decline of 0.8 percentage points, or about 26.7% relative to the original rate. None of those facts alone establishes a problem.
Perhaps the site began appearing for many new, less prominent queries. Separate branded from non-branded searches and inspect pages, devices, and countries. Look for important queries with a relevant page and a weak match between the searcher’s question and your title. Improve the promise and the actual content together. Do not turn every low-CTR query into clickbait.
Do not expect Search Console clicks to equal Analytics sessions exactly. They measure different things with different coverage and processing. A discrepancy is a reason to inspect definitions and setup before assuming either report is broken.
Google also documents a Generative AI performance report for AI Overviews and AI Mode impressions. It may be absent when there is insufficient data. Treat it as visibility within those features, not an all-platform AI audience or customer count. See our AEO guide for a broader measurement routine.
Read the path from a visit to a customer
A channel report tells you where to investigate. A defined funnel tells you which step may need work. For the workshop, a useful sequence is landing page → form started → successful inquiry → qualified inquiry → booked customer. Include business records for the later steps; analytics cannot decide whether a lead is suitable on its own.
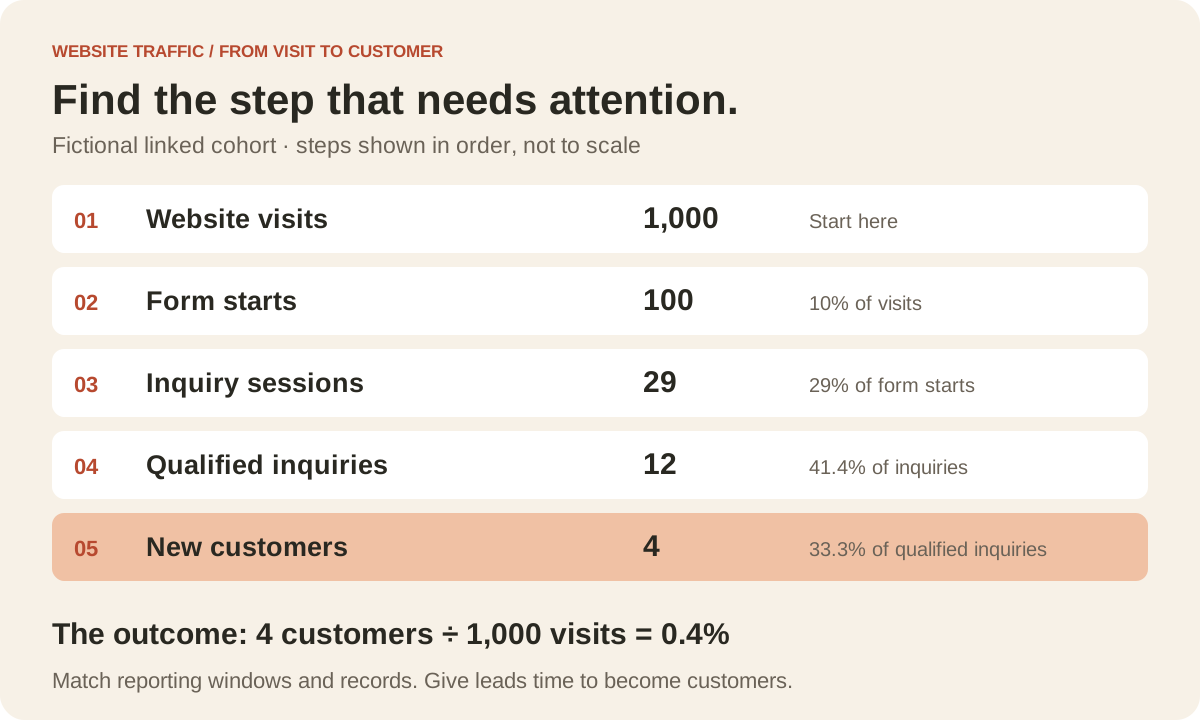
If people start the form but rarely finish, check required fields, errors, mobile usability, reassurance, and response expectations. If inquiries arrive but few qualify, revisit targeting and the offer. If qualified prospects disappear, look at follow-up speed, price, fit, and the sales conversation. More traffic will not automatically repair those steps.
Our diagram assumes each successful inquiry maps to one inquiry session and that downstream outcomes are linked to the same cohort. Real reports may include repeat inquiries and sales that close later. Compare people or records consistently and give the cohort time to mature.
Finish with a decision you can explain
A useful report summary is five sentences: “We wanted to understand ___. We compared ___ with ___. The important change was ___. We checked ___ before interpreting it. Next we will ___ and review ___.”
For our fictional business: “Social brought 300 sessions and three inquiry sessions. We will review its highest-traffic landing page on mobile, compare the offer with the post, and interview two willing visitors. We will correct the clearest mismatch and review the same funnel after another complete reporting period.” That is a more defensible decision than doubling email spend because a small sample had a high rate.
- Use exact counts beside percentages.
- Record what is unknown instead of filling gaps with zeros.
- Choose one meaningful improvement and a review date.
- Keep the report export and the decision together.
Use the Traffic Evidence Center with your own Search Console and acquisition CSVs, or keep a weekly review in This Week. These tools help organize evidence; they do not replace checking your tracking setup.
Sources & further reading
Sources reviewed October 11, 2026. Platform features can change; use the linked documentation for current controls and definitions.
Original Website Traffic editorial guidance. Hypothetical examples and future scenarios are labeled; milestones describe planning stages, not guaranteed outcomes.
Review your traffic evidence ↗